A newsroom guide to checking numbers, units, and comparison periods
A practical editorial workflow for checking units, denominators, percentage points, reporting periods, and rounding in local news.
A correct calculation can still support a misleading sentence. Readers need to understand what was counted and what it was compared with. This guide offers a practical review workflow for reporters and editors handling everyday numerical claims.
Define the comparison before editing the number
Budgets, attendance totals, and complaint counts look familiar, but their meaning depends on what is being counted. Before writing that a figure rose, state whether it covers an entire service or one program, and whether it counts people or visits. Repeat visits do not establish the number of unique users.
Keep a short internal question above the draft: which measure, covering which population, is being compared with which period? If the answer is unclear, check the source definition before placing an increase or decrease in the headline. This note gives the reporter and editor a shared review target.
Keep source units beside display units
Check whether a financial table reports individual currency units, thousands, or millions. Read the table heading, footnotes, and attachment notes. Record the original value, original unit, conversion, and displayed value together so another editor can reproduce the result. For example, 250 million won is 0.25 billion won; changing the scale must not change the amount.
Apply the same discipline to distance, area, and annual versus cumulative totals. Reverse the conversion as a quick scale check. If units are missing or contradictory, ask the source rather than guessing. Do not publish a precise-looking amount whose underlying unit has not been established.
Separate percentages from percentage points
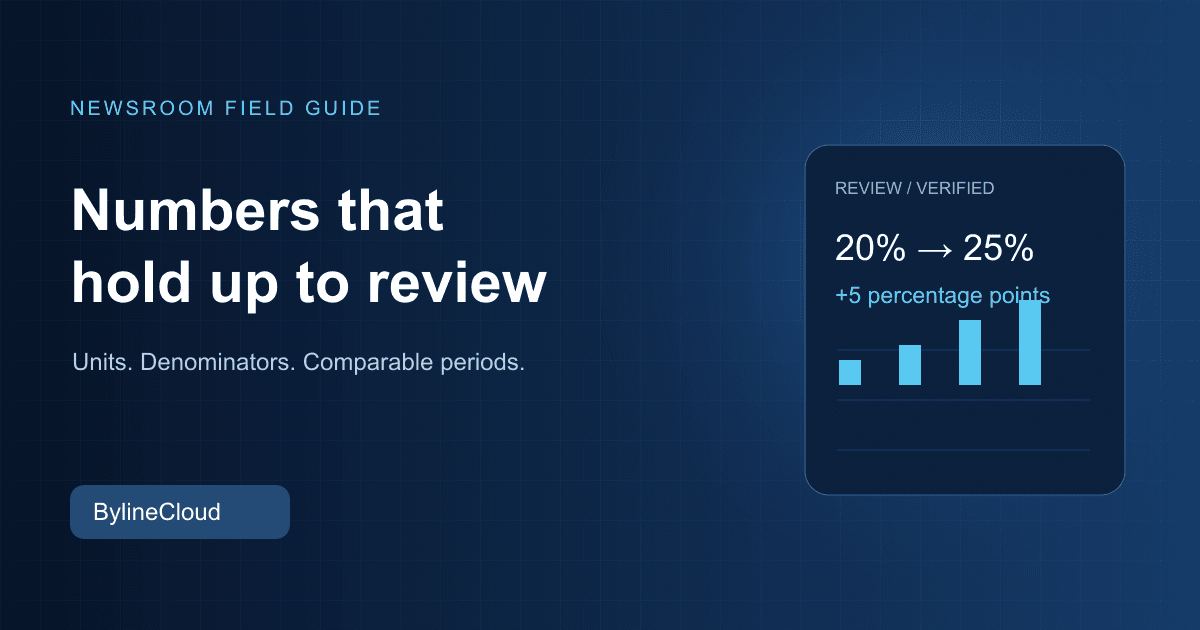
A rate moving from 20% to 25% rises by five percentage points. Its relative increase is 25% of the original rate. Those statements answer different questions. Choose the expression that explains the actual change readers need to understand, rather than calling the difference a five percent increase.
Retain the earlier value, current value, and denominator in the calculation note. When the starting value is zero, do not use the ordinary percentage-growth formula. Say that the count moved from zero to eight. Where the base is small, provide the actual counts alongside a large relative increase.
Match periods and populations
January-through-September activity is not directly comparable with a previous full year. Compare matching months or make the unequal periods explicit. Keep monthly totals separate from cumulative totals, provisional figures from final figures, and survey respondents from the wider population.
Boundary changes or revised collection methods can break a series. Check whether a like-for-like comparison remains possible. If it cannot be established, hold the simple growth claim. Attribute explanations from the collecting organization and describe only the changes you have actually confirmed.
Round at the end and preserve missing values
Repeated rounding during intermediate calculations can alter a final total or rate. Calculate using the available source precision, then choose a consistent display convention. Do not add decimal places that imply a more precise measurement than the underlying source supports.
If rounding explains a small difference between component totals and the displayed whole, add a note. A blank cell, an uncollected value, a not-applicable entry, and zero are not interchangeable. Document how missing values were handled; silently treating them as zero can change both totals and averages.
Review the headline, story, and graphic together
Correct body copy does not guarantee a correct headline or chart. Find the central figures in the headline, summary, text, table, and image description and compare them directly. Inspect chart axes and date ranges so the visual impression supports the written explanation.
A review record can be brief: source file and table location, reference date, conversion formula, comparison period, and reviewer. If the source changes, identify every sentence and graphic affected instead of replacing one number in isolation. This creates a practical route for subsequent updates.
Use a compact number-review card
Before publication, ask whether the original table can be reopened, whether units and denominators are recorded, whether periods match, whether the rate has been recalculated, and whether headline and image values match the body. Resolve unanswered questions or reflect the uncertainty explicitly before handing the draft to the publisher.
This is not a requirement to turn every local report into an advanced statistical exercise. It is a repeatable editing habit for avoiding small inconsistencies that lead readers toward a different conclusion. Keep the review card with the draft, and use it again whenever updated figures arrive.
Start your online newspaper with BylineCloud
We guide you through the entire process, from consultation to launch.
Request Consultation